What Happens to Housing When There’s a Recession?

Since the 2008 housing bubble burst, the word recession strikes a stronger emotional chord than it ever did before. And while there’s some debate around whether we’re officially in a recession right now, the good news is experts say a recession today would likely be mild and the economy would rebound quickly. As the 2022 CEO Outlook from KPMG says:

“Global CEOs see a ‘mild and short’ recession, yet optimistic about global economy over 3-year horizon . . . 

 More than 8 out of 10 anticipate a recession over the next 12 months, with more than half expecting it to be mild and short.”

To add to that sentiment, housing is typically one of the first sectors to rebound during a slowdown. As Ali Wolf, Chief Economist at Zondaexplains:

“Housing is traditionally one of the first sectors to slow as the economy shifts but is also one of the first to rebound.”

Part of that rebound is tied to what has historically happened to mortgage rates during recessions. Here’s a look back at rates during previous economic slowdowns to help put your mind at ease.

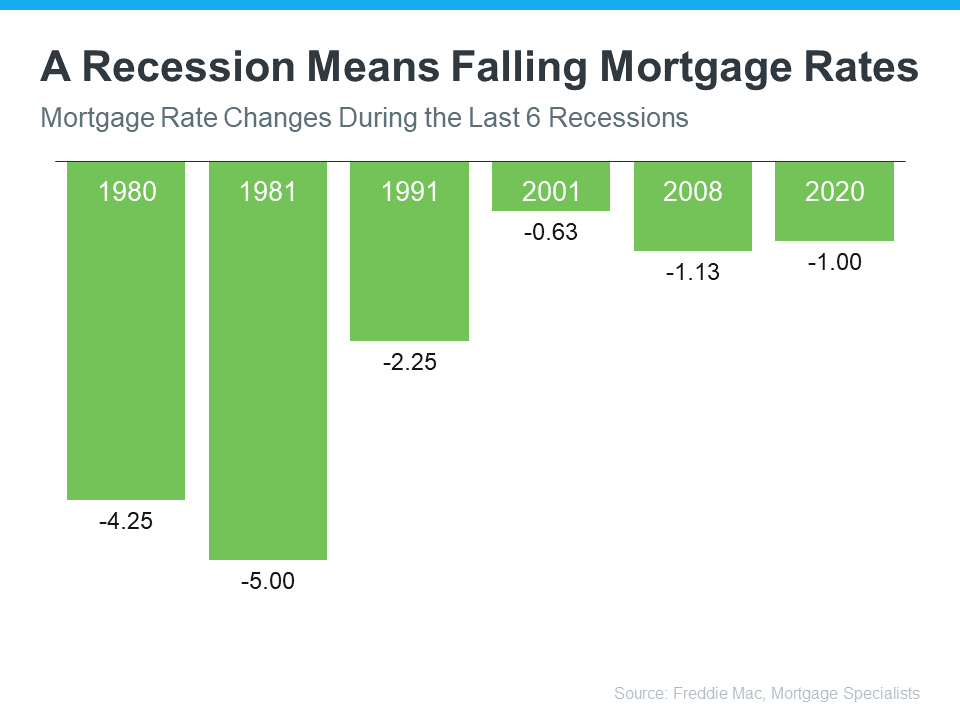
Mortgage Rates Typically Fall During Recessions

Historical data helps paint the picture of how a recession could impact the cost of financing a home. Looking at recessions in this country going all the way back to 1980, the graph below shows each time the economy slowed down mortgage rates decreased.

What Happens to Housing when There’s a Recession? | MyKCM


Fortune explains mortgage rates typically fall during an economic slowdown:

Over the past five recessions, mortgage rates have fallen an average of 1.8 percentage points from the peak seen during the recession to the trough. And in many cases, they continued to fall after the fact as it takes some time to turn things around even when the recession is technically over.”

While history doesn’t always repeat itself, we can learn from and find comfort in the trends of what’s happened in the past. If you’re thinking about buying or selling a home, you can make the best decision by working with a trusted real estate professional. That way you have expert advice on what a recession could mean for the housing market.

Bottom Line

History shows you don’t need to fear the word recession when it comes to the housing market. If you have questions about what’s happening today, let’s connect so you have expert advice and insights you can trust.

703-242-3975 | Info@TheBeltTeam.com | Contact Us

Most Popular Halloween Candy by State – 2022

Halloween is less than a week away…are you ready with the right candy?! The folks at CandyStore.com (a bulk candy retailer and distributor) have compiled 15 years of candy sales data and published the Most Popular Halloween Candy in the US by state again for 2022 (check out their website for a fun interactive map). After a couple of down years for candy sales, they expect this year to be “full-on normal-sized Halloween again.”

The National Retail Federation predicts that the amount spent on Halloween candy this year will be close to $3.1 Billion…an all time high!

To really make sure you buy the right candy, they not only pulled together the top three candies by state, but they also share the list of overall nationwide Best and Worst Halloween Candies. Here’s how they did it…

We looked at 15 years of sales data (2007-2021), looking in particular at the months leading up to Halloween. We sell nationwide (and to Canada) so we broke down our sales by state. We also have relationships with major candy manufacturers and distributors – all of whom contributed and helped us reach our conclusions.

Candystore.com

So Virginia…here are our Top 3!

  1. Hot Tamales
  2. Snickers
  3. Tootsie Pops

And the overall nationwide winners (and loser) are….

Top 10 Best Halloween Candies

  1. Reese’s Peanut Butter Cups
  2. Skittles
  3. M&Ms
  4. Starburst
  5. Hot Tamales
  6. Sour Patch Kids
  7. Hershey Kisses
  8. Snickers
  9. Tootsie Pops
  10. Candy Corn (hmmm….)

Top 10 Worst Halloween Candies

  1. Circus Peanuts
  2. Candy Corn (drops from #1 last year!)
  3. Peanut Butter Kisses
  4. Necco Wafers
  5. Wax Cola Bottles
  6. Smarties
  7. Mary Janes
  8. Tootsie Rolls
  9. Licorice
  10. Good & Plenty

Check out the CandyStore.com blog for more info (including an interactive map and the top 3 candies by state) and make sure you don’t get caught giving out the WRONG treats!!

Let us know in comments what your favorite candy is and if you agree or disagree with your state’s most popular choice!

Introducing our FREE Market Reports!

We know that keeping track of your home’s value is important to you so we built a technology that lets you know exactly what is going on in your neighborhood. Let us introduce you to our FREE Market Reports! Watch the full video to get more details.

This is another valuable service that we can provide to you so that you can keep track of one of your biggest investments – your home. We know that having access to this type of information will create real estate related questions… just know that we are at your service whether it’s question about refinancing, remodeling, or when you’re ready to sell your home.

Contact us to start receiving our Market Report today and to get all of your real estate questions answered!

703-242-3975 | Info@TheBeltTeam.com | Contact Us

Home Sale Statistics in Northern Virginia – September/Q3 2022

Most areas in the Northern Virginia Region saw an increase in the number of new listings coming on the market during September, but the number of homes going under contract was down (and both of these numbers are still down year-over-year…in some cases significantly). This can be explained by the slowing of the market we’ve been seeing. That said, our region and hyper local markets remain relatively healthy and in a Seller’s Market.

This month we also give you a snapshot at some of the 3rd quarter-end statistics for the region overall and some local markets. In short, the numbers of homes sold versus 3rd quarter of 2021 were down across the board.

Northern Virginia September/Q3 2022 home sales:

2,427 homes went under contract in the region. This is down 35% from the same time period in 2021.

41% of the homes that went to settlement in September 2022, sold in 10 days or less from when they hit the market.

• Average sold price was $655,155 (up 3% from the same time period in 2021).

3,531 homes came on the market. That’s down 26% from September 2021.

• Homes that sold (closed) averaged 24 days on market, 6 days slower than in September of 2021.

• There is currently a 1.2 month supply of homes (remember, in a balanced market – the demand from buyers equals the supply from sellers – there is a 5-6 months supply) in the Northern Virginia – and 3,984 homes for sale (townhouse, condo and single-family).

OVERALL: Northern Virginia remained in a Seller’s Market. Inventory increased slightly from the prior month but was down 3.9% year-over-year.  The number of homes going under contract decreased but the number of new homes coming on the market increased…however both of these numbers continue to be down significantly from this time last year.  Average sold price was down from August but was up slightly compared to September last year.

Additional Quarter-End Stats – 2022 vs 2021:

Average sold price increased by 5.6% ($685,417 vs $648,935)

Total units sold decreased by 30%

Average sales price to original list price ratio decreased slightly – 98.8% vs 100.5%

To see what the conditions are like in your community, click on the link to your desired city below! 

Vienna: September 2022 Home Sales

Oakton: September 2022 Home Sales 

McLean: September 2022 Home Sales 

Great Falls: September 2022 Home Sales 

Reston: September 2022 Home Sales 

Falls Church: September 2022 Home Sales 

Arlington: September 2022 Home Sales

Alexandria: September 2022 Home Sales  

*Data compiled from SmartCharts, MarketStats by ShowingTime, whose data comes directly from the Multiple Listing Service (MLS).

If you are thinking of buying or selling, please reach out to The Belt Team and let us help you navigate this unprecedented market.

(703) 242-3975 | Info@TheBeltTeam.com | or fill out our Contact Us form

43108 Candlewick Square, Leesburg VA 20176 – Just Listed by The Belt Team!

Welcome to 43108 Candlewick Sq located in Potomac Station! This beautifully updated townhome has 3 bedrooms/3.5 baths, and over 2,400 square feet of living space on 3 finished levels. Stand out features include an updated eat-in kitchen with island & breakfast bar, stainless steel appliances, gas cooking, 42′ cabinets and granite countertops, a spacious living room with bay window, a separate dining area, hardwood & tile flooring on main level, bump-out in back for all levels (provides for the main level family room, the primary bedroom’s sitting area & lower level den/office), a primary bedroom suite with vaulted ceiling, attached bath, walk-in closet & sitting/dressing room, and a finished walkout lower level with gas fireplace, office/den area and bonus room. The back deck looks out over trees and the lower level fenced in patio includes a great storage shed! All of this and more in a great Leesburg location…close to many amenities, historic downtown Leesburg, and convenient for travel/commuting. Don’t miss your chance to make this wonderful property your next home!

 
Call Terry Belt for more details or to schedule a showing! 703-242-3975
 

Reach out to The Belt Team if you are thinking of buying or selling. The Belt Team has been in business for over 50 years and has sold over $1 Billion in transaction volume! 

Free Instant Online Home Valuation – What Is My Home Worth?

The Cost of Waiting for Mortgage Rates To Go Down

Mortgage rates have increased significantly in recent weeks. And that may mean you have questions about what this means for you if you’re planning to buy a home. Here’s some information that can help you make an informed decision when you set your homebuying plans.

The Impact of Rising Mortgage Rates

As mortgage rates rise, they impact your purchasing power by raising the cost of buying a home and limiting how much you can comfortably afford. Here’s how it works.

Let’s assume you want to buy a $400,000 home (the median-priced home according to the National Association of Realtors is $389,500). If you’re trying to shop at that price point and keep your monthly payment about $2,500-2,600 or below, here’s how your purchasing power can change as mortgage rates climb (see chart below). The red shows payments above that threshold and the green indicates a payment within your target range.

The Cost of Waiting for Mortgage Rates To Go Down | MyKCM

As the chart shows, as rates go up, the amount you can afford to borrow decreases and that may mean you have to look at homes at a different price point. That’s why it’s important to work with a real estate advisor to understand how mortgage rates impact your monthly mortgage payment at various home loan amounts.

Are Mortgage Rates Going To Go Down? 

The rise in mortgage rates and the resulting decrease in purchasing power may leave you wondering if you should wait for rates to go down before making your purchase. Realtor.com says this about where rates could go from here:

“Many homebuyers likely winced . . . upon hearing that the Federal Reserve yet again boosted its short-term interest rates by three-quarters of a percentage point—a move that’s pushing mortgage rates through the roof. And the already high rates are just going to get higher.

So, if you’re waiting for mortgage rates to drop, you may be waiting for a while as the Federal Reserve works to get inflation under control.

And if you’re considering renting as your alternative while you wait it out, remember that’s going to get more expensive with time too. As Nadia Evangelou, Senior Economist and Director of Forecasting at the National Association of Realtors (NAR), says:

“There is no doubt that these higher rates hurt housing affordability. Nevertheless, apart from borrowing costs, rents additionally rose at their highest pace in nearly four decades.”

Basically, it is true that it costs more to buy a home today than it did last year, but the same is true for renting. This means, either way, you’re going to be paying more. The difference is, with homeownership, you’re also gaining equity over time which will help grow your net worth. The question now becomes: what makes more sense for you?

Bottom Line

Each person’s situation is unique. To make the best decision for you, reach out to Terry Belt & The Belt Team to explore your options.

703-242-3975 | Info@TheBeltTeam.com | Contact Us